The Spectrum Probe
by Steven K. Roberts N4RVE
73 Magazine
January, 1990
Inexpensive and portable spectrum analyzer.
There’s nothing quite like the frequency domain for revealing what’s going on in a system. Down in the slow-moving mechanical world, Fast Fourier Transform (FFT) analyzers are used to determine the resonance characteristics of structures and to help predict failures. In RF systems, high-performance spectrum analyzers instantly spot harmonics and spurious noise. All of this is impossible with trusty time-domain instruments like oscilloscopes.
A spectrum analyzer is simple in concept. Just imagine sweeping the center frequency of a filter upwards from a low value, displaying the amplitude of the signal that passes through it on a scope that sweeps at the same rate. If you repeat this quickly in synchrony with the scope trace, you have a spectrum plot, with horizontal displacement indicating frequency and vertical indicating amplitude. Put an antenna on it, and you have a snapshot of the electromagnetic spectrum.
The problem is that most spectrum analyzers are expensive — $10-$40,000 from the major instrument vendors. Isn’t there a way to hang something on the front of a cheap oscilloscope to produce the same effect?
A Spectrum Plot — Cheap
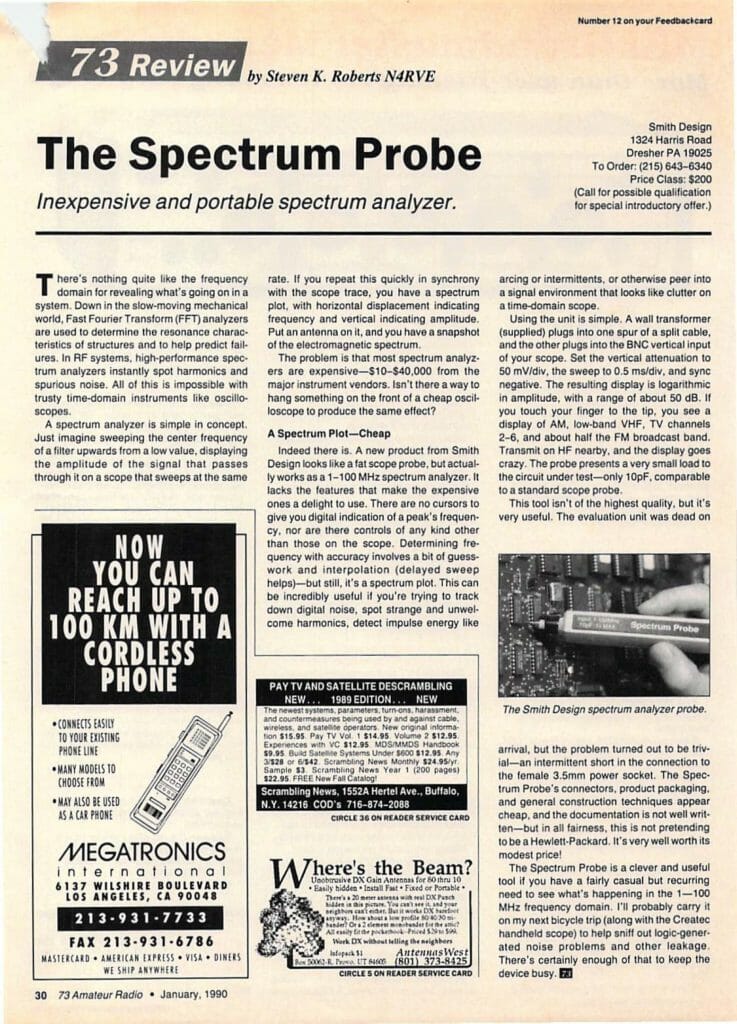
Indeed there is. A new product from Smith Design looks like a fat scope probe, but actually works as a 1-100 MHz spectrum analyzer. It lacks the features that make the expensive ones a delight to use. There are no cursors to give you digital indication of a peak’s frequency, nor are there controls of any kind other than those on the scope. Determining frequency with accuracy involves a bit of guesswork and interpolation (delayed sweep helps)—but still, it’s a spectrum plot. This can be incredibly useful if you’re trying to track down digital noise, spot strange and unwelcome harmonics, detect impulse energy like arcing or intermittents, or otherwise peer into a signal environment that looks like clutter on a time-domain scope.
Using the unit is simple. A wall transformer (supplied) plugs into one spur of a split cable, and the other plugs into the BNC vertical input of your scope. Set the vertical attenuation to 50 mV/div, the sweep to 0.5 ms/div, and sync negative. The resulting display is logarithmic in amplitude, with a range of about 50 dB. If you touch your linger to the tip, you see a display of AM, low-band VHF, TV channels 2-6, and about half the FM broadcast band. Transmit on HF nearby, and the display goes crazy. The probe presents a very small load to the circuit under test — only 10pF, comparable to a standard scope probe.
This tool isn’t of the highest quality, but it’s very useful. The evaluation unit was dead on arrival, but the problem turned out to be trivial — an intermittent short in the connection to the female 3.5mm power socket. The Spectrum Probe’s connectors, product packaging, and general construction techniques appear cheap, and the documentation is not well written — but in all fairness, this is not pretending to be a Hewlett-Packard. It’s very well worth its modest price!
The Spectrum Probe is a clever and useful tool if you have a fairly casual but recurring need to see what’s happening in the 1—100 MHz frequency domain. I’ll probably carry it on my next bicycle trip (along with the Createc handheld scope) to help sniff out logic-generated noise problems and other leakage. There’s certainly enough of that to keep the device busy.
You must be logged in to post a comment.