The Winds of Change
I had a very enjoyable visit in Slidell, Louisiana in mid-April of 1984, leading to stories in the Daily Sentry-News as well as shorter pieces in the St. Tammany Times and Times-Picayune. My host, David Smith, gave me a tour of the National Weather Service office… resulting in this piece in my Online Today series as well as a longer chapter in Computing Across America.
by Steven K. Roberts
Online Today
August, 1984
(written in April, 1984)
When you live on a bicycle, certain things take on larger-than-life significance. Hills, for example, never mattered much when I drove a car, and back roads were just that: back roads.
And then there’s the weather. An effective way to become really conscious of wind, rain, temperature and humidity is to simply get rid of your house, pack everything important on a bicycle and live year-round on the road. What once was a pleasant breeze might now be a brutal headwind, a treacherous sidewind or an exhilarating tailwind.
During the first 5,000 miles of this journey, I have gradually become attuned to these things. I’ve learned to judge a cycling day by the feel of the morning air and the susurration of leaves. Barring unexpected flat tires, I can now pretty well target my arrival at the home of a distant host so that it occurs only minutes before dinner time. Awareness of weather conditions is, indeed, a key to survival.
Imagine my delight, then, when David Smith, my host in Slidell, La., offered (after dinner) to give me a grand tour of the National Weather Service installation where he works. This would have been technologically appealing anytime, but especially so with the famed headwinds of Texas within a few hundred miles.
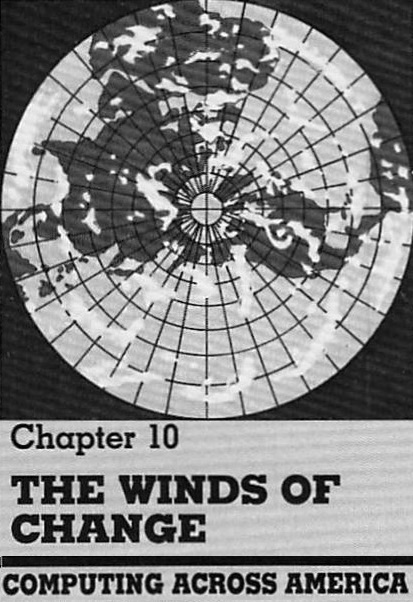
I walked into the nearly windowless building late at night, finding a half-dozen men peering at screens, drinking coffee and making cryptic notations on maps. But what immediately captured my attention was a row of high-resolution displays that showed continuously repeating “loops” of recent satellite images. Clouds rolled across the screens, the past 24 hours compressed into seconds.
Standing there, contemplating a current and dynamic bird’s-eye view of North America, I watched the fluid patterns hypnotically repeat. Around me bustled routine activity: templates slapping against maps, jargon-filled conversations, the background noise of printers and facsimile machines and telephones.
“Like it?” asked a voice beside me. I had evidently been transfixed for some time. I turned to meet a grinning Walter Copes, satellite meteorologist, who in the next hour or so performed a brain dump on subjects ranging from the fine points of satellite image processing to the underlying causes of hurricanes.
His discourse explained the jet stream, why Kansas is dry, how boats can be knocked over by a distant thunderstorm, how the global monitoring system works, and where the uncertainties lie.
That doesn’t necessarily make it predictable, however. Until recently, all this technology was unable to beat 50 percent accuracy in forecasting — a figure that could be achieved much more cheaply with the toss of a coin. Now, they say, it’s on the order of 80 percent for the next 12 hours and 60 percent for a 5-day extended forecast (anything beyond that is called an outlook, not a forecast). As the computer models become more accurate and take more factors into consideration, the level of accuracy slowly, very slowly, increases.
But deficiencies in the models are many. The relatively stable weather patterns in the Midwest offer little challenge to the system, but the area around the Gulf complicates matters. Factors as diverse as the Texan “dry line,” water reflectivity, the Gulf stream, and volcanic activity thousands of miles away all interact to determine whether or not it will rain here tomorrow. And this is where one final element enters the picture . . .
Human intuition. The need for human judgment in forecasting, say the experts, is almost gone. They prefer to think of the “educated guess” as the product of a natural bent for statistics, not of unquantifiable intuitive understanding. There’s a running Art vs. Science battle here as there is in many fields, with, as my host observed, “some of us looking at the computers with doubt, others treating them as gospel.”
“But,” he added, “none of us can ignore them anymore.”
Intrigued by all this, I decided to put the system to a test. “Will I have a headwind enroute to Hammond tomorrow?” I asked.
“Well, we have a low coming in this way. . .” someone began.
“Yeah, but it’ll probably move into the upper atmosphere by morning,” David observed, pointing at a map strewn with numeric data.
“I don’t know, Dave. The last time this happened it settled right over here and stayed for awhile.” He pointed vaguely at an area just north of us. The discussion went on, with contributions from various experts and machines. The general consensus, if one could be said to have existed, was that I would be buffeted most of the day by a sidewind from the south.
At about that time, all eyes turned to a standard television set, mounted in a rack next to the network communications processor. The 11 o’clock news was on, and an impeccably groomed weatherman was soundlessly gesturing at a colorful U.S. map highlighted with cute graphic symbols for sunshine, rain and snow.
“Aha!” I couldn’t help but exclaim, “this is where you get your data!” (The chuckles were polite. It was an old joke around there.)
The TV weathercaster looked at his information and smoothly predicted a headwind. Hmmm. “They can draw their own conclusions,” David said. “They receive some of our maps, but use their own radar and surface data.”
The bottom line, of course, is that weather forecasting is still — and will remain for many years — something of a black art, supported by a complex and capable set of tools. But the tools are the creations of people who do not yet fully understand the system they have set out to model.
And thus the sky is full of surprises, like the pleasant tailwind that sped me along the next day to the start of a two-week adventure in Hammond, Louisiana.
Steve Roberts publishes a more current account of his adventures in a CompuServe database (GO CAA for details). His CompuServe User ID is 70007.362.
Editor’s note: Steve Roberts, Online Today’s nomadic journalist, is currently traveling around the United States on a recumbent bicycle. He uses a Model 100 for both writing and communications. During this trip, which is expected to cover 15,000 to 20,000 miles, Roberts is writing regular columns for Online Today, as well as a book entitled Computing Across America, which will be published in 1985 by Simon & Schuster.


You must be logged in to post a comment.